How fast must it switch?
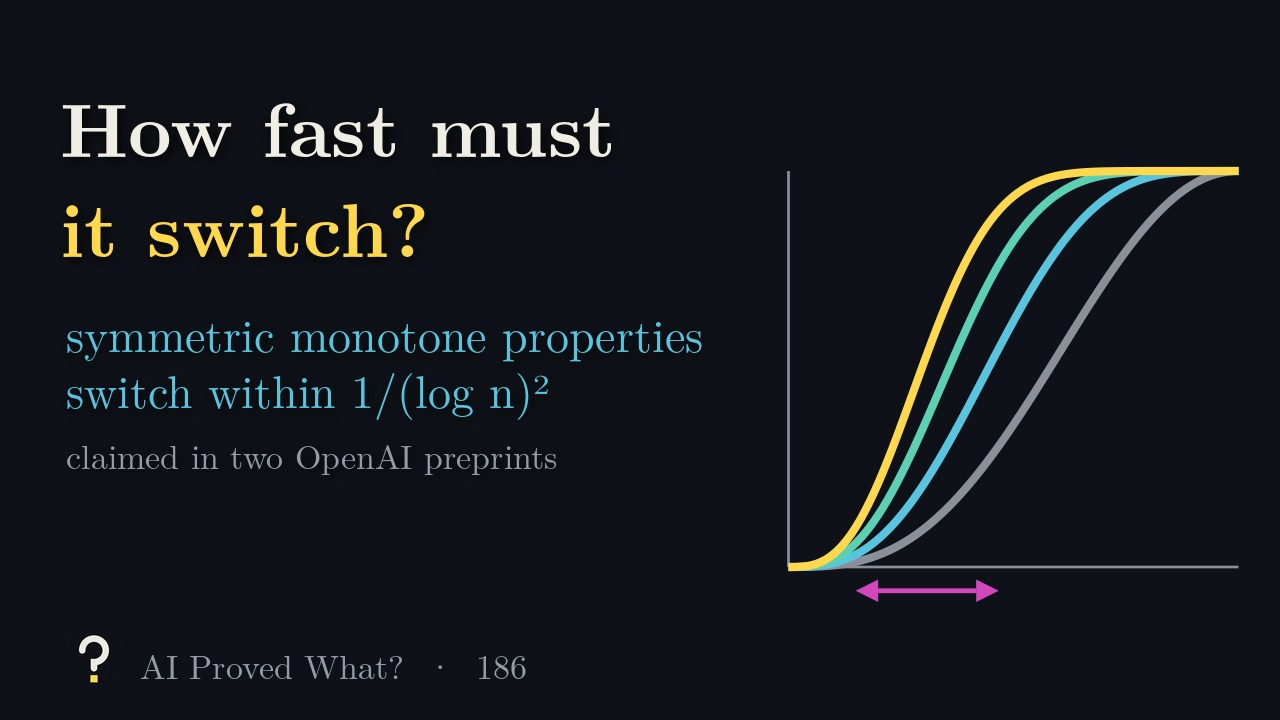
Two preprints claim that every symmetric increasing property of a random graph switches on within a window of order 1/(log n)², as Friedgut and Kalai conjectured, and the analogue for hypergraphs
Covers result 186 in OpenAI’s catalog: all 2 papers. See its connections to other results and the work it cites.
8:42. English captions available. The video loads from YouTube when you press play.
Chapters
The claim, in plain words
Link every pair of n dots independently with probability p, and take a property of the resulting network that ignores how the dots are labelled and that adding links can never destroy: containing a triangle, being connected, having no isolated dot. As p rises, the chance that the property holds climbs from 0 to 1. The question is how quickly: how far apart in p are the points where the chance reaches 10% and 90%? In our exact count over every labelled network, the window for “contains a triangle” narrows from about 0.52 on 4 dots to about 0.32 on 7.
The graph paper tells the history this way. Kahn, Kalai and Linial (1988) connected Fourier analysis with the influence of single coordinates; Bourgain, Kahn, Kalai, Katznelson and Linial extended this to product spaces. Friedgut and Kalai (1996) combined it with the Margulis–Russo formula and proved that every such graph property switches within a window of width at most C log(1/(2ε))/log n, and conjectured (log n)² in the denominator. That would be best possible: they pointed to containing a clique of size proportional to log n, whose window can be of order 1/(log n)². Bourgain and Kalai (1997) came within an arbitrarily small power of the logarithm, (log n)−2+η for every η > 0, and Kelman, Kindler, Lifshitz, Minzer and Safra (2020) proved a related influence bound at p = 1/2.
Result 186 is two OpenAI preprints. A Sharp Threshold Bound for Monotone Graph Properties (10 pages, dated September 25, 2026) proves, as its Theorem 1.1: “For every integer n ≥ 2, every nontrivial increasing family P of graphs on n vertices invariant under all vertex permutations, and every 0 < ε < 1/2, p1−ε(P) − pε(P) ≤ 219 log(1/(2ε))/(log n)².” It follows from Theorem 1.2: for every Boolean function f on the edges invariant under vertex permutations and every 0 < p < 1, Varp(f) ≤ 217 Ip(f)/(log n)², where Ip is the total influence; “No monotonicity assumption is needed.” A uniform influence bound for hypergraph properties (8 pages, dated October 5, 2026) uses the graph paper’s method for r-uniform hypergraphs, r ≥ 3: Varp(f) ≤ Cr Ip(f)/(log n)r/(r−1), and for increasing properties a width of at most 2Cr log((1−ε)/ε)/(log n)r/(r−1), proving Friedgut and Kalai’s hypergraph conjecture; the constant Cr is shown to exist but not computed.
What it doesn’t claim
A useful number: the graph paper calls its constant “only a convenient explicit choice”, and by our arithmetic its width bound beats the trivial width 1 (at ε = 0.1) only when n exceeds about 10398.9. The content is the rate in n. The width is measured in p itself, so for properties that switch close to p = 0, such as connectivity, it tells us nothing new (our observation). It is a worst case: typical properties switch much faster, by our calculations (in our exact calculation, “no isolated dot” has a window of about 3/n). It is not about where thresholds sit, the subject of results 175 and 176; the graph paper says its proof uses neither. The hypergraph paper does not claim that its exponent r/(r−1) is best possible, and the width bounds need monotonicity, though the variance–influence inequalities do not.
Where it stands
- Posted as preprints
- OpenAI: graph paper, 10 pages, September 25, 2026; hypergraph paper, 8 pages, October 5, 2026
- Peer reviewed
- Not yet
- Checked in Lean
- The graph theorem, exactly as stated, formalized by OpenAI; not run by us. The hypergraph paper: no Lean
Last checked October 19, 2026. Neither preprint has been revised since they were added to the repository in its initial commit on October 6, 2026. OpenAI published a Lean formalization of the graph paper: the comparator statement matches Theorem 1.1 exactly, with the constant 219, and the development also proves the variance inequality with 217. By our count it takes 78 files and 7,699 lines, excluding Mathlib (source). We found no unproved steps by search; we have not rebuilt the proof. The collection’s formalization.yaml does not list this result, though the Lean is linked from its scope note. The hypergraph paper has no Lean formalization. Neither paper is among those OSVerify reviewed, and we have seen no expert review.
How the proof goes
- From slope to width. By the Margulis–Russo formula, which the paper works out directly, the slope of the curve is the total influence. For a yes-or-no property the variance is μ(1−μ), so Theorem 1.2 forces the log odds log(μ/(1−μ)) to climb at rate at least (log n)²/217; integrating gives the window.
- Fourier weight. In the Fourier basis for coins of bias p, the variance is the total squared weight and p(1−p) times the influence weights each term by its degree, so weight above degree L is at most p(1−p) I/L; the proof shows that low-degree weight is small compared with the influence. The first tool (Lemma 2.1, in the style of Kahn, Kalai and Linial; the paper proves the two-point inequality directly and uses Bonami’s product argument): if no coordinate carries more than a 1/m share of the influence, the weight up to degree √(p(1−p)) log m/64 is at most m−1/4 I.
- The vertex block. Leave free every link touching a random block of about √n dots and fix all other links. Permutations of the block move no fixed link, so each restricted property is still symmetric under them; every free link lies in a group (orbit) of at least m links, and the first tool applies, averaged exactly over the fixings.
- The degree trade. A Fourier term’s set of links, seen as a graph with at most k²/2 edges, has a vertex touching between 1 and k of them; with probability at least m/(2n) the block catches that vertex and no other vertex of the term. So control up to degree k becomes control up to degree k²/2, proportional to p(1−p)(log n)². In the high-degree weight that factor cancels, and the constants fit under 217.
- Hypergraphs. An r-graph with s edges has a vertex of positive degree at most r s(r−1)/r, which gives the exponent r/(r−1). The graph paper credits random restrictions with symmetry (Bourgain–Kalai; Kelman et al.) and the Fourier tools to earlier work; what it adds is choosing the restriction through a vertex block, and the degree trade. The hypergraph paper calls its r-uniform degree bound “the additional combinatorial step”.
The numbers in the video
- Exact curves over every labelled network on 4 to 7 dots (2,097,152 networks on 7): for “contains a triangle” the 10%-to-90% window runs from 0.3049 to 0.8260 on 4 dots (width 0.52) and from 0.1492 to 0.4670 on 7 dots (width 0.32).
- Margulis–Russo, “contains a triangle” on 6 dots at p = 0.3: each of the 15 links has influence 0.170935, and their sum, 2.564022, equals the slope to 12 digits.
- Fourier weights of “contains a triangle” on 6 dots at its median p = 0.3557: 42% of the variance at degree 1, then 10%, 28%, 12%.
- The constants: 8192 × 9 + 256 = 73,984 ≤ 217; the width bound is below 1 (ε = 0.1) only when log n > 918.6.
- “No isolated dot” (exact formula): window 0.0459 at 64 dots, 0.0119 at 256, 0.0030 at 1,024, about 3/n. Cliques of size proportional to log n, by a rough Poisson estimate of ours: width × (log n)² about 0.63 at 103 dots down to 0.42 at 1030.
- The block: with 100 dots and a block of 10, 945 of the 4,950 links stay free (45 inside the block, and 10 to the block from each of the 90 others). The degree fact holds on every graph with up to 7 dots (largest ratio of the lowest positive degree to √(2s): 0.926, at K7).
- The Lean count: our count of the import closure.
Read the source
- A Sharp Threshold Bound for Monotone Graph Properties (PDF), 10 pages.
- A uniform influence bound for hypergraph properties (PDF), 8 pages.
- The Lean scope note.
- The collection’s catalog, where this is result 186.
The 2 papers in this result
OpenAI groups related papers, such as alternative proofs, supporting results and consequences, into one result; we label the first paper it lists the main paper and the others companions.
Transcript
Read the full script
0:00The question
Take n dots, and link each pair independently with probability p. Now pick a property of the network: it contains a triangle, it is connected, or no dot is left without a link. The property must not care how the dots are labelled, and adding links must never destroy it. As p rises from zero to one, the chance that the property holds climbs from zero to one. The question is how quickly. Measure the window: the distance in p between the point where the chance reaches 10% and the point where it reaches 90%. Our exact count over every labelled network shows the trend. For a triangle on 4 dots, the window runs from about 0.30 to 0.83, a width of about 0.52. On 7 dots it runs from about 0.15 to 0.47, a width of about 0.32. Must every such property switch on quickly once the network is large, and at what rate? The papers trace the tools to Kahn, Kalai and Linial, in 1988, who tied the Fourier analysis of yes-or-no functions to the influence of single coordinates. Bourgain, Kahn, Kalai, Katznelson and Linial extended that to product spaces. In 1996, Friedgut and Kalai combined it with the Margulis–Russo formula, and proved that every such graph property switches within a window of width at most a constant, times the log of one over two epsilon, divided by log n. They conjectured that the denominator can be log n squared. That would be the best possible rate: they pointed to containing a clique of size proportional to log n, whose window can be of order one over log n squared. Bourgain and Kalai, in 1997, came within an arbitrarily small power of the logarithm, with the exponent two minus eta, for every eta greater than zero. And in 2020, Kelman, Kindler, Lifshitz, Minzer and Safra proved a related influence bound at p of one half, short of log n squared by a factor of log log n squared.
2:02The claim
Result 186 is two OpenAI preprints. The first, 10 pages, dated September 25, 2026, claims a proof of Friedgut and Kalai’s conjecture, with an explicit constant. For every n of at least two, every nontrivial increasing graph property that ignores labels, and every epsilon between zero and one half, the window from epsilon to one minus epsilon has width at most 2^19, divided by log n squared, times the log of one over two epsilon. It follows from a stronger inequality. For any yes-or-no property of the network that ignores labels, monotone or not, and for every p, the variance is at most 2^17, divided by log n squared, times the total influence. The second preprint, 8 pages, dated October 5, extends this to hypergraphs, where each link joins r dots, for every r of at least three. The window shrinks like one over log n to the power r over r minus one, with a constant depending on r that the paper shows exists but does not compute. Not claimed: a useful number. The constant is, in the paper’s words, only a convenient explicit choice. By our arithmetic, the width bound beats the trivial width of one only when n exceeds about 10^399. The content is the rate in n. The width is measured in p itself, not relative to where the switch happens, so for properties that switch close to p equal to zero, such as connectivity, it tells us nothing new. And it is a worst case. Typical properties switch much faster: in our exact calculation, having no isolated dot has a window of about three over n, 0.003 at 1,024 dots. Cliques of size proportional to log n are the slow ones; by our rough estimate, their windows, times log n squared, stay between about 0.4 and 0.6, from 1,000 dots to 10^30. Nor is this about where thresholds sit, which results 175 and 176 address; the graph paper says its proof uses neither. And the hypergraph paper does not claim that its exponent is best possible.
4:20How the proof goes
The proof starts from slope. By the Margulis–Russo formula, which the paper works out directly, the slope of the curve at p equals the total influence: the sum, over all links, of the chance that flipping that one link changes the answer. In our check, for a triangle on 6 dots at p of 0.3, each of the 15 links has influence 0.171, and the sum, 2.564, equals the slope to 12 digits. For a yes-or-no property, the variance is the chance times one minus the chance. So the variance inequality says the slope is at least log n squared over 2^17, times that variance. The log odds must climb at a guaranteed rate, and integrating that rate gives the window. Everything rests on the variance inequality. To prove it, the paper expands the property in a Fourier basis adapted to coins of bias p. Each term is labelled by a set of links, and the size of the set is the term’s degree. The variance is the total squared weight of the terms; p times one minus p, times the influence, counts the same weight with each term multiplied by its degree. So high-degree weight is cheap: above any degree, it is at most p times one minus p, times the influence, divided by that degree. The danger is low degree. For the triangle on 6 dots, 42% of the weight sits at degree one; the proof shows that for large n, low-degree weight must be small compared with the influence. The first tool follows the method of Kahn, Kalai and Linial, with a 2-to-4 inequality that the paper proves using Bonami’s product argument. If no single link carries more than a one over m share of the influence, then the weight up to a degree proportional to the square root of p times one minus p, times log m, is at most m to the minus one quarter, times the influence. The new move is to freeze most of the network. Pick a random block of about the square root of n dots. Leave free every link that touches the block, and fix every other link, whatever its value. Shuffling the dots inside the block moves no frozen link, so the frozen property is still symmetric under every reshuffle of the block. With 100 dots and a block of 10, 945 of the 4,950 links stay free, and each lies in a group of at least m lookalikes, so none carries more than a one over m share. The first tool applies to every freezing, and since its bound is linear in influence, it averages back exactly. The second ingredient treats each Fourier term’s set of links as a small graph. A graph with at most k squared over two edges has a vertex touching between one and k of them. With probability at least m over two n, the block catches that vertex and no other vertex of the term, leaving between one and k of its links free. So control up to degree k becomes control up to degree k squared over two, proportional to p times one minus p, times log n squared. In the high-degree weight that factor cancels, and the constants fit under 2^17. For hypergraphs, a vertex of degree at most r times s to the power r minus one over r plays the same role, giving the exponent r over r minus one. The paper credits random restrictions with symmetry, and the Fourier tools, to earlier work; what it adds is choosing the restriction through a vertex block, and this degree trade.
7:47Where it stands
Both preprints are unrefereed and have not been revised. OpenAI’s Lean files state the graph theorem exactly, with the constant 2^19, and prove it, together with the variance inequality, in 78 files and about 7,700 lines, with no gaps we could find by search; we did not run the check. The hypergraph paper has no Lean formalization, and its constant is not computed. Neither paper is among those OSVerify reviewed, and we have seen no expert review. If it holds, every label-blind, monotone property of a large random network switches on within a window of order one over log n squared, the best possible rate, as Friedgut and Kalai conjectured, and r-uniform hypergraphs follow with the exponent r over r minus one.
Spot a mistake?
This episode simplifies on purpose, but it shouldn’t be wrong. If something is, open an issue on GitHub or leave a comment on YouTube. Corrections are noted here with a date.